The most important welding-related issues are:
- Need to reduce our welding costs
- Improving productivity of welding operations
- Can't find trained welders
- Can't afford to purchase new equipment
- Need to simplify our welding process
How these Key Business Issues (KBIs) manifest themselves depends on a company's business emphasis or organizational structure. For example, to meet the demands of a large project, company A may emphasize increased productivity. Company B, faced with the same scenario, may believe it needs to improve operator efficiency. Company C, knowing its welders already produce at maximum output, may want to add personnel but has trouble finding qualified welders. The welding supervisor at Company D knows that investing in new equipment will enable him meet demand, but he's having trouble convincing the finance committee. And the operations manager at Company E knows he could increase output if he could only find equipment that reduced operator errors.
Key Business Issues are often interrelated, and the solution to one KBI usually improves other areas. After all, increasing productivity should ultimately lower welding costs, provide the basis for equipment investment and potentially offset manpower requirements.
For real
world examples of how companies address Welding KBIs, visit MillerWelds.com/Results. This Web site features quick-read executive summaries, expert advice and third-party testimony. Companies of all sizes and types candidly discuss their welding issues, the solutions they considered and the results they achieved. The bullet points below highlight some of the ways companies address their Key Business Issues, while the copy below them features some of the successes showcased on the MillerWelds.com/Results Web site.
Reducing Weld Cost Solutions:
- Understand true cost of welding (consider all variables; see next section) and reduce accordingly
- Reduce weld metal volume (e.g., prevent over-welding)
- Minimize reject, rework and scrap rates
- Eliminate pre-weld preparation steps (e.g., applying anti-spatter spray)
- Eliminate post-weld grinding of spatter and excess weld metal
- Avoid paying overtime
- Reduced
wasted effort, unnecessary motions and delays
- Reduced arc time
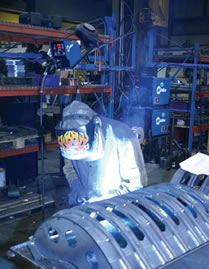 |
| By switching to the Axcess™ pulsed MIG welding system, OEM Fabricators reduced weld costs by up to $2000 per day. |
Fabrication example: OEM Fabricators, a fabricator of components for world-class construction and ag equipment, recently reduced weld costs by up to $2,000 per day. By switching to the Axcess® pulsed MIG welding system, the company now uses one type of machine, one wire and one gas for nearly all of its welding. In the process, OEM Fabricators eliminated grinding, spatter and chipping slag, eliminated gas change-over time (switching between C25 for short circuit MIG and 100 percent CO2 for flux cored welding), reduced weldment reposition and improved operator-to-operator consistency.
Construction example: Mechanical contractor AZCO cut its rental costs 40 percent by using the 12 kW generator power of the PipePro™ 304 to run an XMT® 304 CC/CV inverter. Two operators can Stick weld simultaneously, yet the company only needs to rent, fuel and maintain one engine drive. On a recent power plant project, this combination saved AZCO $46,000 in nine months.
Increasing Productivity Solutions:
- Reduce cycle time and arc-on time
- Improve operating factor (arc time/total labor time = operating factor)
- Increase deposition rates/travel speed
- Minimize reject and rework rates by welding it right the first time
- Eliminate unnecessary/unplanned downtime
- Understanding sources of bottlenecks and eliminate them
- Eliminate activities that do not add value (e.g., implement Kaizen)
- Implement Lean Manufacturing techniques
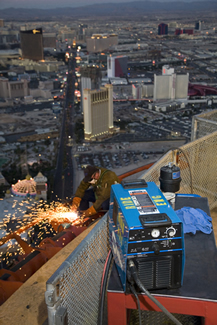 |
| Stratosphere Hotel and Casino ride engineers reduced cutting time by about 55 percent with a Spectrum plasma cutter. |
Fabrication example: As part of applying Kaizen to its operations, a structural steel bridge manufacturing contractor asked 13 of its experienced welders to weld 12-inch-long, 5/16" fillet welds, using 1/16"-diameter FCAW wire in the 2F position. The welders were asked to execute the test plates at their own workstations, reproducing the welding parameters used for production. The quality results were disastrous! Twelve out of 13 welders failed to produce welds to the required specification, and nine of 13 failed to produce acceptable penetrations. By applying Kaizen, changing the welding technique and increasing the wire-feed speed, the company solved the penetration problems while increasing travel speed an average of 59 percent.
Construction example: When the Stratosphere Hotel & Casino needed to remove its High Roller coaster (located 850 ft. above the Las Vegas strip) ride engineers could only cut and remove sections of the coaster between 2:00 - 7:00 a.m. With this time crunch, and given that all workers were on overtime pay, the director of ride engineering wanted to use the most efficient (and safest) cutting process possible. To meet these needs, he purchased a Spectrum plasma cutter. Using the plasma process reduced cutting time by about 55 percent. With plasma, each section of track took three minutes to cut...compared to seven minutes using the oxy-fuel process.
Welder Shortage/Operator Efficiency Solutions:
- Use machines that are easier for operators to set-up and understand to minimize training time
- Use machines that maintain/ensure optimum welding parameters (e.g., machines with parameter limiting/lockout features)
- Increasing operator productivity/efficiency may eliminate the need to hire additional welders
- Implement programs and procedures to grow operator skills and improve consistency
 |
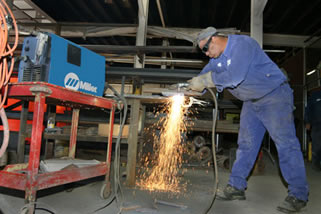
| A1A Dock Products invested in two new Dynasty® AC/DC TIG inverters with advanced squarewave technology which improved the company's productivity from 25 to 32 ladders per day. |
Fabrication example: A1A Dock Products, a small company manufacturing aluminum dock ladders, sold every ladder it made and still couldn't meet demand. To address the issue, A1A Dock Products invested in two new Dynasty® AC/DC TIG inverters, even though its existing Syncrowave® welders worked fine. The Dynasty's advanced squarewave technology immediately enabled the company's two welders to improve productivity from 25 to 32 ladders per day. "Our ladders cannot cost more than the competition, so I don't want to hire more manpower. But since we have such a demand, I'd rather invest in better machinery to upgrade production and pay our fabricators a little more to keep them happy," says president Helmut Grundler.
Construction example: Contractor Dawson Welding needed to erect a structural steel deck at Fenway Park, home of the Boston Red Sox, in time for opening day. Initial forecasts called for 18 to 22 Ironworkers to complete the job. "However, we always need less manpower because we have better equipment. The average company will put in around 30 pounds of [flux cored] wire per day, where we do an average of 68 pounds per operator," says Rob Dawson, owner/operator of Dawson Welding. Dawson's equipment includes Big Blue diesel engine drives, which feature a strong CV output for flux cored welding. This enables Dawson to run leads up to 600 ft. long (roundtrip distance; 4/0 cable) and weld with 5/64-inch diameter E70T-7 wire.
Equipment Justification Solutions:
- Understand payback and ROI calculations used by owners, senior managers, accountants and banks
- Analyze and understand true sources of welding costs
- Obtain energy efficiency and utility rebates
- Decrease maintenance costs/time
- Minimize unscheduled downtime
Fabrication example: As noted above, AIA Dock Products invested in two new Dynasty 300 welders with water-cooled torches even though its existing TIG welders worked fine. Total list price for the new equipment: $14,400. Many companies would question the sanity of this decision, but performing a simple payback calculation (see below) shows that A1A Dock Products knows how to make smart business decisions.
|
Miller Economic Evaluation Summary: A1A Dock Product
|
- Annual Savings (present minus proposed costs*)
- Investment (equipment list price)
- Annual Depreciation (Line 2 divided by 5 years)
- Annual Savings After Depreciation (Line 1 minus Line 3, assumes straight-line depreciation)
- Profit After Taxes (66% of Line 4)
- Annual Cash Savings (Line 5 plus Line 3)
Return on Investment (Line 6 divided by Line 2 X 100)
Payback Period (Line 2 divided by Line 6 X 12 months)
|
$28,2242
$14,4003
$ 2,8804
$25,3445
$16,7276
$19,607
136 %
8.8 months
|
| *By increasing productivity from an average of 25 to 32 ladders per day, A1A lowered labor costs by $3.15 per ladder. Assuming 280 workdays per year: 280 days X 32 ladders X $3.15 labor savings = $28,224 saved per year. |
 |
| By increasing cutting productivity with a Spectrum plasma cutter, Bedrock Stone lowered operating costs by $1000 per week. |
Construction example: Bedrock Stone employs four full-time fabricator/welders to perform maintenance and repair tasks in its concrete recycle facility. When the fabricator/welders only used oxy-acetylene torches for cutting, overhead costs for Bedrock's maintenance shop averaged about $6,000 per week. After switching to plasma cutting, costs average $4,000 to $5,000 per week (costs vary based on work load). Using conservative accounting methods (see below), the Spectrum produced an amazing ROI and payback.
|
Miller Economic Evaluation Summary: Bedrock Stone, Inc.
|
- Annual Savings (present minus proposed costs*)
- Investment (equipment list price)
- Annual Depreciation (Line 2 divided by 5 years)
- Annual Savings After Depreciation (Line 1 minus Line 3, assumes straight-line depreciation)
- Profit After Taxes (66% of Line 4)
- Annual Cash Savings (Line 5 plus Line 3)
Return on Investment (Line 6 divided by Line 2 X 100)
Payback Period (Line 2 divided by Line 6 X 12 months)
|
$52,000
$3,737
$747
$51,253
$33,827
$34,574
925%
1.3 months
|
| *By increasing productivity, Bedrock lowered operating costs by $1000 per week. |
Time Equals Money
Many welding-oriented companies claim - and rightfully so - that, "People are our most important asset." When it comes to welding, people (labor) also constitute the single large largest welding cost variable (see pie chart, below).
The vast majority of manual and semi-automatic welding costs come from labor, according to a variety of different industry sources.
But if people are so important, why do so many companies spend an inordinate amount of effort on less important issues (equipment and consumable prices) while ignoring the most important component (maximizing labor efficiency)? The answer can only be that these companies have not measured, tracked, analyzed and improved upon the variables that affect their welding cost...and if you don't measure something, you can't manage it.
Below are some of the items and costs that could - and probably should - be measured in order to provide a baseline for managing a welding operation:
Fixed or "hard goods" costs:
- Labor rate
- Overhead cost
- Cost of filler metal (includes deposition efficiency)
- Cost for shielding gas (if used)
- Cost for other consumables (grinding wheels, anti-spatter compound, backing bars, etc.)
- Cost for electricity or fuel
- Cost for raw materials (per part, if applicable)
- Material cost related to reject rates (significant when working with highly alloyed or exotic metals)
Time-based costs ([labor rate+overhead rate] x man-hours):
- Prepare the metal for welding (e.g., shot blasting, degreasing, etc.)
- Prepare the joint (e.g., cutting, beveling, grinding, if applicable)
- Assemble components (e.g., place in fixtures, jigs, etc.)
- Apply anti-spatter compound, if used
- Pre-heating time, if required
- Tack weld components, if required
- Position/re-position weldment, if required
- Arc-on time
- "Air time" (moving between welds)
- Interpass cooling time, if applicable
- Grinding spatter
- Chipping slag
- Grinding/polishing weld bead to final size/appearance
- Removing anti-spatter compound
- Welder self-inspection of weld
- QA/QC inspection and tests
- Rework/repair of welds and subsequent re-inspection and re-testing
- Time lost due to rejected components
- Changing electrodes (new Stick rod, spool of wire, etc.)
- Process change-over time (e.g., switch between MIG root and flux cored fill passes)
- Cylinder swap-outs
- Post-weld heat treating costs and time, if applicable
To find waste in a system (e.g., potential areas for improvement), ask yourself this key question: is Step B in your process true preparation for Step C, or is it compensation for the inefficiency of Step A? If you spend time on activities such as grinding spatter, chipping slag, grinding welds down to final size or reworking/repairing parts, you are not preparing the part for the next step. You are compensating for the inefficiency of the welding system, which potentially adding thousands of extra dollars in welding costs.
As a real world example, one world-class manufacturer (we can't mention their name) used to dedicate two employees per shift for the task of post-weld grinding and weld repair. That's a total of 16 man-hours per day. Using a conservative overhead rate of $25/hour, this post-weld activity cost the company $400 per day, or $2,000 per week. After switching to a new Miller welding system that minimized spatter and improved first pass weld quality, one employee working one hour per day now performs all the grinding and rework. The labor cost for this activity is 5 hours x $25 = $125 dollars...or a savings of $1,875 per week.
The above situation is not unusual. Many companies accept post-weld activity as a fact of life, because "That's the way it's always been done." However, given the savings potential of about $100,000 per year, and the ability to free up the time of two valuable employees, the company wisely chose to go through the "pain of change" and upgrade its welding process.
To help you make a decision regarding an equipment investment, process upgrade or procedure change, compare your current cost of welding vs. the projected cost of the new method. Then, use the formula in the Miller Economic Evaluation Summary to determine your ROI (which is always expressed as a percentage) and your Payback Period (expressed in months or other time unit). If you need help understanding the potential of new welding technology, contact your welding supply distributor or your Miller district manager. [Representatives from Hobart Brothers Company (filler metals), Bernard (MIG guns) and Weldcraft (TIG torches) can also offer valuable solutions.]
While Miller obviously has a vested interest in selling welding equipment, company representatives - from salesmen to service personnel to factory employees - recognize that, ultimately, they only succeed when customers experience their own business success. For a mutually rewarding long-term relationship, a supplier partner must truly seek solutions to customer problems rather than the sale of a system.
In that spirit, Miller created the MillerWelds.com/Results site. We hope that the success of your peers inspires your own success.
Extra Reading
For more information and guidance on the economics of welding, consider reading Chapter 10 of the Certified Welding Supervisor Manual for Quality and Productivity Improvement*, available from the American Welding Society (www.AWS.org). This chapter, titled "Welding Economics and Variables," covers the following topics:
1. Reduced Weld Metal Volume
2. Reduced Arc Time Per Weldment
3. Reduced Rejects, Rework, and Scrap
4. Reduced Work Effort
5. Reduced Motion and Delay Time
The information on the cost of over-welding alone should open some eyes with regards to sources of possible welding improvements. For example, if the leg of a fillet weld should be 3/16 in. but the welder over-welds and makes a 5/16 in. weld instead, the joint would require a 177 percent increase in weld metal deposition and take 177 percent more arc-on time to complete!
* Jack R. Barckhoff, Kenneth M. Kerluke, Don L. Lynn, Certified Welding Supervisor Manual for Quality and Productivity Improvement (Miami: American Welding Society, 2005)